
Capitol Lake - The Healthiest Lake in Thurston County
by Dr. David H Milne © June 15, 2015
Capitol Lake is an environmental treasure that is worthy of preservation for many reasons, and sustainable by well known routine management procedures, notably dredging and plant harvest, for all of the foreseeable future.
This Report is intended to inform busy interested readers that Capitol Lake is a major community asset, in as few words as possible. That hasn’t been easy. The Lake is under attack by nay-sayers, has many positive features that the public doesn’t know about, and has changed in ways that require understanding and action after a long period of neglect. The main body of this Report presents all of this.
This online version does not include all notes & references. PDF files are available at the end of this report, including references to show readers where to look for the sources of the facts and assertions made in this Report. The Notes and References are to confirm that the facts enumerated in this Report are reliable findings, resulting from two years of study and fact-finding by the author. PDF Download & Print versions section at report end
Executive Summary
- Capitol Lake has high dissolved oxygen levels in its deepest waters all year long, no toxic blue green algae blooms, and clean water that has met bacteriological and other standards for swimming since 2000. No other monitored Thurston County lake has all of these positive features.
- Capitol Lake (like seven other local lakes, several sites in Budd Inlet, and sites in some rivers) is listed in violation of EPA Clean Water Act Section 303(d). One reason for this (bacterial levels) has been corrected, the other (phosphorus) can only be corrected by changes in upland land use.
- Capitol Lake has met water quality standards for swimming during the last 15 years.
- Capitol Lake provides extensive habitat for native aquatic species that are “sensitive” - (Olympic Mudminnows) or vulnerable to habitat loss (freshwater mussels) elsewhere in the state and region.
- By its suitability for emergent aquatic insects, Capitol Lake supports some 3000 bats from one of the biggest bat colonies in Washington State.
- If an estuary were to replace the Lake, the estuary would probably support more non-native introduced species than does the Lake at present.
- Capitol Lake takes up most of the inorganic nutrient nitrogen carried seaward by the Deschutes River every summer and prevents it from entering Puget Sound during the growing season.
- The Lake is being ecologically damaged by drawdowns that prevent succession of a mature freshwater community of native species that could control New Zealand Mud Snails.
- The reputation of the Lake has been clouded by alarmist signs, closures, and actions focused on New Zealand Mud Snails; trash-strewn shores; mats of plants floating at the surface; systematic omission of positive Lake news in news media; selectively negative agency reporting, managerial neglect, and memories of the Lake’s polluted past.
- All of these negative issues are reversible, some of them easily.
I. Introduction
I-1. The Lake and the Controversy
Capitol Lake is at the center of an ongoing, low-profile community argument about the future of west-central Olympia, Washington near the State Capitol campus. The lake was created in 1951 by the damming and impounding the Deschutes River, causing the river water to permanently flood a tidal basin that stretched from present-day 5th Avenue to Tumwater Falls.
In recent years, vocal activists have called for removal of the dam and return of the basin to the ebb and flow of the tides. Others in the community have defended the Lake and called for its continued existence. The paper that follows is intended to clarify several environmental aspects of any decision to remove or substantially modify the Lake.
The current attack on the Lake is sustained by a widespread public belief that the Lake is “sick;” polluted and hazardous to human and environmental health. A second wide-spread belief is that the Lake’s existence is detrimental to the water quality of nearby Puget Sound. These beliefs are misinformed and mistaken.
I-2.The Lake and the Claims
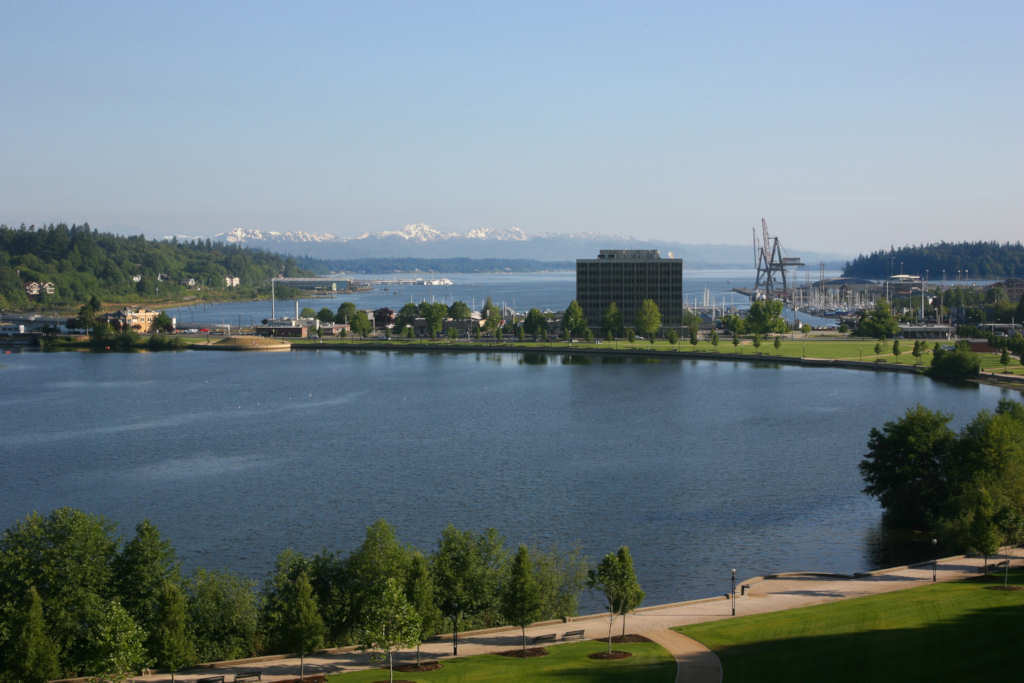
Capitol Lake is the conspicuous body of fresh water that visitors to the State Capitol see situated between 5th Avenue and the Capitol campus. It is approximately 270 acres in extent and has an average depth at present of about 9 feet (TCPHSS, 2012). To the north of 5th Avenue lie the salt waters of West Bay, one of the southernmost arms of Puget Sound. The Lake and the Bay are connected via an actively manipulated tide gate in the dam under 5th Avenue.
The Lake is widely regarded as a polluted water body by the public at large, as often exemplified by comments in the Olympian newspaper. For example, a letter to the editor by Shanewise (2015) refers to “… the unflushed toilet of the lake”.
- 1) the Lake is weedy and its shores and waters are strewn with trash;
- 2) the Lake is a Federally listed water body “in violation of Article 303(d) of the Clean Water Act”;
- 3) the Lake is unfit for swimming;
- 4) the Lake is inhabited by introduced aquatic species, of which European water-milfoil (Myriophyllum spicatum) and the New Zealand Mud Snail (Potamopyrgus antipodarum) are the most frequently cited biotic offenders (TCPHSS 2012 and later).
For the record, Capitol Lake is probably the healthiest lake in all of Thurston County. The Federal listing mentioning bacteria (see below), made in 1998, is now obsolete thanks to diversions of storm drains and sewers over the last three decades, and the Lake’s modern clean water would not be so listed by any impartial agency. Based on Regulatory Standards, the Lake has been clear and clean enough for swimming during the past 15 years, and the “threat” posed by the introduced species is vastly exaggerated. And although the visual floating weed cover in unattractive and certainly impairs boating and swimming recreation, it is not symptomatic of pollution and would be easily eliminated by proper management of the Lake.
To balance the discussion, positive features never mentioned in the negative public clamor (for example, high dissolved oxygen levels and the Lake’s absence of toxic blue-green algal blooms) make Capitol Lake the best of all lakes in the area.
Capitol Lake and its related environs, water quality issues, management and recent history is described in detail in Thurston County’s biennial Water Resources Reports (TCPHSS 2012). The Reports cover pairs of “water years”. The most recently published one was released in 2012 and covers water years 2009-10 and 2010-11. Data for years after the most recent publication should be sought at the Department’s website (see TCPHSS 2012 in References). That Report covers many lakes and streams in Thurston County besides Capitol Lake. For the purposes of this paper, some of this information is included in the following.
II. Capitol Lake: Its recent History & Management
II-1. Capitol Lake, Its formation and Early History

Before 1951, the area in front of the State Capitol campus was occupied by tidal waters. The present-day Lake basin was flooded twice daily by tides that can rise and fall over a range of some 22 feet throughout the year (Polk, 1906). Figure 1 shows a partial view of the former estuary as it appeared in 1944, looking northward over what is today the North Basin of Capitol Lake (CLIPA 2010). The intertidal mud covered a larger area than the present-day Lake, extending all the way to Water Street and Fifth Avenue at that time (Figure 1).
The Lake was formed in 1951 when the narrow inlet to the basin (at the location of the present day 5th Avenue bridge, upper left corner in the photo) was dammed. Since then, the basin has usually been dominated at its surface and in its upper reaches by fresh water, with salt water admitted daily to the depths of the North Basin.

The Lake today is divided into the three basins shown in Figure 2. Most (about 90%) of its fresh water enters the South Basin from the Deschutes River; the rest flows into the north end of the Middle Basin from Percival Creek. The large shallow Percival Cove, once broadly connected to the estuary, is now connected to Lake only at the mouth of Percival Creek. Tidewaters of the earlier estuary sometimes entered all the way up the basin to Tumwater Falls at the extreme south end of the modern Lake.
The Lake was formerly a popular site for recreation. A guide to hiking and boating around South Puget Sound lists the Lake’s amenities as “Picnic tables, fishing pier, swimming beach, float, hiking trail, rest rooms” and activities available to visitors as “picnicking, swimming, canoeing, kayaking, hiking and fishing (Mueller and Mueller, 1983). Motor boating and water skiing are reported by the Capitol Lake Committee (1974) as other recreational uses. Figure 3 shows a photo from that era.

The lake was closed to swimming in 1985 because of high coliform bacteria levels and cloudy water (DES 2002). It was closed to boating, fishing, and other water-contact sports in 2009 as a precaution against spreading the newly intro-duced New Zealand Mud Snails (Johannes, 2010a). The Lake is still a popular destination for bird watchers, people walking around its shores during lunch breaks, people walking dogs, picnickers, and visitors to the State Capitol.
Beginning in 1968, Capitol Lake was routinely drained of much of its fresh water, then refilled with salt water two or three times per year. These “drawdowns” consisted of opening the tide gates at the dam during a low tide in the adjacent salt water and allowing the Lake’s water to run out. The lake was then refilled by allowing salt water to flood back in. The reasons for these manipulations varied and included controlling algae and aquatic plants in the Lake, enabling maintenance and repair operations around the lake shore, and “assisting out-migrating salmon”. (Johannes, 2010a).
Routine drawdowns of this sort occurred up to three times a year from 1968 through 1984, then twice annually from 1984 to 1995. Once in 1992 and during the last routine drawdown in 1996, the tide gates were closed after the drawdown and the Lake was allowed to refill with fresh water from the Deschutes River. This was an effort to preserve freshwater organisms. After 1996, routine drawdowns were discontinued. However, “planned drawdowns” followed by refilling of the Lake with fresh water have been numerous ever since. These have generally been to prevent downtown flooding when high tides coincide with heavy rain, to enable repair and inspection of drain pipes, to enable repair of the Deschutes Parkway after the 2001 earthquake, and (since 2009) to try to kill New Zealand Mud Snails during freezing weather (Entranco, 1997; TCEHD 2003).
II-2. Salmon in the Lake: The Early Years
Prior to construction of the dam, the Deschutes River had no natural salmon runs. The river passage for anadromous fish was completely blocked by Tumwater Falls. The River’s lowermost tributary, Percival Creek, supported natural runs of anadromous fish (chum and silver [coho] salmon and possibly a few Chinook salmon), most of which spawned in the lower mile or so of the Creek. In the early years (1949 – mid 1950’s) the River was stocked with adult Chinook salmon transported above the Falls by tank trucks. Capitol Lake itself was stocked with hatchery-raised Chinook fingerlings in the years immediately after it was formed (Engstrom-Heg, 1955; Capitol Lake Committee, 1974).
The blockage of the Deschutes River was bypassed by construction of “fish ladders” (completed in 1954), as was a difficult low-water passage in Percival Creek. A fish holding facility for retrieval of salmon eggs was completed in (present-day) Tumwater Falls Park in 1962. Finally, the (then) Department of Fisheries began rearing young Chinook salmon in Percival Cove in 1971. In 1973, six million young Chinooks were reared in the Cove. This program ended in the mid-90’s amid concern that the operation was adding high levels of nitrogen nutrients to the Lake.
The effects of these activities were spectacular. As many as 27,000 salmon returned to the Lake each fall and crowds of up to 5,000 people per day gathered to watch egg-collection demonstrations at the holding facility by 1974 (Capitol Lake Committee, 1974). In the words of the Committee, “Capitol Lake is Washington State’s most important fish rearing impoundment, having greater recreational and monetary value than any other fish farm in the State” (p. 7, Capitol Lake Committee 1974).
II-3. Learning as we go; The Need for Lake Maintenance
It became clear during the 1970’s that the newly created Lake would need routine main-tenance. The main problematic developments presenting themselves at the time were high levels of coliform bacteria in the swimming area, growth of aquatic vegetation, and infilling of the South Basin by sediment from the Deschutes River. Several studies, followed by recommendations for maintenance, mostly focused on dredging and coliform contamination, were conducted during that decade (Orsborn et al 1975; CH2M-Hill 1978). All of them affirmed the high value of the Lake to the community. The coliform problems have been eliminated (see below) but the need for dredging and vegetation management remains.
The Deschutes River delivers about 35,000 cubic yards of sediments to Capitol Lake each year. The effect has been to reduce the area of the Lake from about 320 acres to its present 270 acres, largely fill in the South Basin, and reduce the average depth of the Lake by about 4 feet (Hayes et al, 2008, pp 4-5). Dredging has occurred only twice to my knowledge; in 1975-79 and 1984-86, resulting in removal of about 20% of the sediment that had accumulated by that time.
II-4. Recent Lake Management and Political Developments
Administratively, the Lake is part of the State Capitol Campus. As such, its maintenance is not the responsibility of any city or county. The State General Administration agency was formerly responsible for its upkeep, security, authorization of public events (such as fireworks displays) and other administrative matters (between 1951 and 2003). This agency was reorganized and emerged as the Department of Enterprise Services in 2003, which maintained its role as the Lake’s overseer. DES manages the Lake following policies approved by the State Capitol Campus Committee, a body of elected individuals with ultimate responsibility for the Lake. The Committee decides upon actions that affect the Lake, creates policies regarding its usage and maintenance, and sends directives to DES for actual implementation. The members of the Committee are the Governor or his/her designee, the Commissioner of Public Lands, the Secretary of State and the Lieutenant Governor.
In 1999, an Environmental Impact Statement was compiled examining six alternative Lake Management Strategies. Two of the alternatives were to convert the Lake back into an estuary, three were freshwater alternatives, and a sixth was a “no action” alternative. These were analyzed by a “CLAMP” (Capitol Lake Adaptive Management Plan) Steering Committee, which released its findings in October, 2002 (see DES 2002; “A Vision For The Next Ten Years”). Intense political lobbying emerged within this committee, aimed at converting the Lake back into an estuary. This eventually prompted three State Agency heads to issue a letter stating their support of that objective (Manning et al, 2009) and encouraged local activists to continue demanding it.
These important developments dominate the discussion today. The main Lake nay-sayers are estuary advocates, and it appears to me (the author) that very capable agency personnel are burdened by the shadow of a past policy recommendation made by two former (and one present) directors.
The Report that follows is an effort to show Capitol Lake as the healthy, valuable asset to our community that it really is, and to dispel mistaken claims that it is unhealthy. Because of the political backdrop, it is occasionally necessary to mention comparisons with its proposed estuary replacement.
III. What's "Wrong" (and RIGHT) with Capitol Lake?
The next sections discuss issues that are said to be problematic. Because the Lake’s designation as an impaired water body as per the EPA’s Clean Water Act 303(d) listing is perhaps its most widely cited “fault,” we begin with that topic.
III-1. The EPA 303(d) Action List
The “303(d) violation of the Clean Water Act” invariably cited by would-be destroyers of Capitol Lake is a clause in an extensive set of definitions, recommendations, and regulations released by the Federal Environmental Protection Agency (EPA) in 1972. The Act requires the States to designate all salt and fresh waters into one of five categories. It does this through section “303(d)”. Category 1 water is the best and Category 5 is the worst (i.e. polluted). Waters designated as Category 5 require the states to take action to remedy the problem(s). In Washington State, the Department of Ecology (henceforth “Ecology”) is responsible for proposing standards for EPA perusal and for recommending which water bodies to list.

Many water bodies in Thurston County are flagged as “Category 5” problem sites besides Capitol Lake. Table 1 shows all of the lakes and two of the flowing waters thus identified. In addition, Budd Inlet has many listings that can be examined by interested readers. The “Inner Harbor” (adjacent to the 5th Avenue dam) has some 70+ separate 303(d) category 5 listings, mostly for organic chemicals and heavy metals in sediments and “tissues” (fish), plus one for “dissolved oxygen” in the water. These can be examined firsthand via the “Ecology” 303d Website shown in the References.
Capitol Lake was listed by “Ecology” as a Category 5 violator of bacterial and phosphorus standards in 1998 (DeMeyer, 2015). It has remained so listed ever since. We will see in the following that the Lake would not be so listed for bacteria were it evaluated today. Its coliform concentrations have been comfortably within the standards for the last 15 years.
The bottom line of this discussion is that Capitol Lake is just one of several fresh and marine water bodies in Thurston County that have the negative 303(d) designation. It is not an isolated case as is always implied by the Lake’s detractors.
The Department of Ecology is supposed to revise and update the 303(d) list every two years, alternating between fresh and salt waters. This process is finally under way for the first time in 15 years as this Report is being written (spring 2015). The agency appears to be searching for a way to keep Capitol Lake on the 303(d) Category 5 list, despite the Lake’s 15 year history of low coliform counts.
The following two sections describe coliform bacteria and phosphorous, the two reasons for the 303(d) listing, in more detail.
III-1A. Coliform Bacteria - Standards and a Cleaned-Up Lake
Coliform bacteria (including Escherischia coli or “E. coli”) live mainly in the intestines of warm-blooded animals. They assist their host animals with digestion of food; intestines are their “natural habitat”, so to speak. The vast majority of these bacteria are harmless to their hosts and other animals.
Coliform bacteria exit the bodies of their hosts in the hosts’ feces. If the fecal matter finds its way into water, the bacteria are liberated. There they can survive for a few days and sometimes even slowly reproduce, but water is not their natural habitat and they soon die. While waterborne, they can be collected by microbiologists and cultivated on plates of nutrient gel. After a few days each bacterium multiplies enough to create a spot of new cells visible by microscope or even to the unaided eye. These spots are counted and an estimate is made of the number of bacteria present in the original water sample. These “coliform counts”, as they are called, are the key to deciding whether water poses a health risk to people.
The presence in water of coliform bacteria themselves is not considered a health risk. Rather, their presence indicates that sewage is entering the water somehow – via failing septic drainfields, undiscovered sewer lines discharging into storm drains and hence into the water, seepage from restroom facilities, swimmers with diarrhea, toilet discharges from boats and ships, and other sources. If infected people are in the area, sewage can carry much more dangerous – even deadly – organisms that also exit the body via feces. These include the organisms that cause giardiasis and cholera and certain intestinal parasites. Most of these “pathogens” (organisms that cause sickness) are not as easy or inexpensive to detect as are E. coli bacteria themselves. So, if the E. coli count is high, it is presumed that there is a significant risk that some other potentially deadly sewage-borne pathogens may also be present, and contact recreation in that water body is banned as a health precaution.
How high must the E. coli count be, to warrant the precaution of closing a lake to swimming? The strictest standard used in Washington State has two parts.
- Part 1 is that the “geometric mean” (a type of average; see this note) of a number of measurements must be lower than 50 bacteria per 100 mL of water taken for each measurement, in order for “contact recreation” to continue.
- Part 2 is that, if some measurements show counts greater than 100 bacteria per 100 mL, even in a sample whose mean is low, such measurements must constitute no more than 10% of the total number of measurements in the whole sample.
That is, if either the average of the whole sample exceeds 50 bacteria/100 mL of water or counts constituting more than 10% of the whole sample exceed 100 bacteria per 100 mL of water, then the water body must be closed to swimming. Thurston County uses a less stringent standard for swimming beach closure; namely:
- Part 1; the beach is closed if water samples have a geometric mean of 100 or more bacteria/100 mL, or;
- Part 2; counts constituting more than 10% of the whole sample exceed 200 bacteria per 100 mL of water (TCPHSS 2014).
In this Report I usually refer to the more stringent standard. Capitol Lake meets that standard for all but one measurement (out of 197) from 2000 through 2014, and virtually all of the measurements if compared with the County’s less stringent standard.

Figure 4 shows the geometric means of coliform counts from Capitol Lake for the entire 15-year period, 2000-2014. The highest average of the 15-year period is 15.54 E. coli/100 mL (in 2013); the lowest is 2.17 (in 2002). As can be seen from these data, the average coliform counts have been far below the stringent 50 E. coli/100 mL standard for that whole period.
In all of the years 2000-2014, only two of 197 Capitol Lake E. coli measurements exceeded the 100 E. coli/100 mL Part 2 of the most stringent standard. Those two high counts are shown in Figure 5, in which counts exceeding 100 for Black Lake are also shown. The two blue bars for Capitol Lake show that 105 colonies/100 mL were seen in 2006 and 163 in 2011. For Black Lake, values higher than 100 (ranging from 141 in 2010 to 1066 in 2008) occurred on 10 occasions.
The only violation of the stringent Part 2 coliform standard was Capitol Lake’s reading of 163 in 2011. Since the whole sample consisted of only 9 measurements, that high reading constituted 11% of the measurements – a Part 2 violation. The samples at Black Lake were all of size 20 or more. Thus the two very high Black Lake coli-form measurements in 2008 con¬stituted 10% or less of those samples – no violations there. By the less-stringent standard, (highest count of 10% of samples > 200), there were no violations at all in Capitol Lake throughout those 15 years.

What happened to the high coliform bacteria sources that ultimately closed the lake for swimming in 1985? One cringes at reports written during the swimming era and afterwards. One memo on coliform bacteria near Heritage Park describes a “24 inch metal storm sewer pipe located on the south side of the swimming area …” with black sludge in front of it and a strong odor of hydrogen sulfide rising from the turbid water pouring out. The coliform concentrations measured in that water were 2,300 and 3,700 E. coli colonies per 100 mL in June 1983, down from about 17,000 in March of the year before (Singleton and Bailey, 1983).
Like many of the discharges, this one was below the filled lake surface and available for inspection only when the Lake was drawn down. One by one, such drains were hunted down and eliminated or diverted.
For visualization of the improvement, the 2,300 E. coli per 100 mL measurement, if plotted on the graph in Figure 4, would be a point some four feet higher than the top of the page.
To summarize with regard to coliform bacteria, Capitol Lake has met the County’s coliform bacteria standards for swimming during every one of the years 2000 – 2014.
III-1B. Phosphorus ... Everywhere ...
Nutrient chemicals based on two elements, phosphorus and nitrogen, are often important underpinnings of water quality impairment. Unlike coliform bacteria, which could be indicative of a threat to human health, the nutrients alter the ecology of the waters themselves, sometimes in ways deemed undesirable by humans. One of these – phosphorus – is partly responsible for Capitol Lake’s “303(d) violation” status. At present, this is the only parameter currently out of compliance with numerical standards.

Figure 6 shows 10 lakes in Thurston County that are monitored for their phosphorus concentrations by the Thurston County Department of Public Health and Social Services (TCPHSS). At every lake except Capitol Lake, two measurements are usually made each month (one at the surface and one at the bottom), from May through October inclusive. Only surface concentrations of P are reported for Capitol Lake
Capitol Lake has the highest surface phosphorus concentrations of the 10 monitored lakes (see Figure 7). The surface phosphorus levels in the North and Middle Basins of Capitol Lake and five other Lakes (Black, Lawrence (W&S), Long (N), Pattison, and St. Clair (W & E)) all exceed the state “action level” standard (0.020 mg/L).

The bottom waters of all of the monitored lakes contain much more phosphorus than do the surface waters (Figure 8). In this regard, Capitol Lake levels are lower than those of four other lakes (Black, Hicks, St Clair and Ward) and about the same as all of the rest.
Phosphorus enters natural waters from some human sources (mainly fertilizers, also animal intensive agriculture), and from geologic leaching of soils and rocks. It seems likely that the amount of phosphorus in the Deschutes River (annual averages of 0.048 and 0.065 mg/L during water years 2009-10 and 2010-11) will continue to be high for the foreseeable future (TCPHSS 2012, Des-chutes River p 98). Such levels are much higher than the 0.020 mg/L standard. If that is the case, then there is no immediate prospect of removing Capitol Lake from the EPA 303(d) action list. This is a watershed issue that can only be addressed by changes in upland land use practices.

III-2. Features of a Healthy Lake
III-2A. What About Swimming?
Between 1964 and 1985 Capitol Lake was a hugely popular place for swimming (Figure 9). The swimming area (opened in 1964) was a cove in the shoreline that was characterized by weak back-eddy circulation (TCPHSS “memo,” 2003). It was also the discharge site of five storm drains, some of them perhaps connected to sanitary sewers (CH2M Hill, 1978). After many difficulties with high coliform bacteria levels and increasing water cloudiness (“caused by algae blooms;” DES 2002), the lake was closed to swimming in 1985.
Two water quality standards apply to swimming. One is the two-part “mean of 50 colonies/100 mL or less” and the “no more than 10% of samples exceed 100 colonies/100 mL” stringent coliform bacteria standard discussed above. The other is that the water must be clear enough that objects four feet deep or deeper are visible from the surface (say, to lifeguards).

As shown above, Capitol Lake met the state’s most stringent coliform bacteria requirements, except for just one measurement in 2011, during almost all of the 15 years from 2000 to 2014. If the County’s standard were used, Capitol Lake’s record would be near-perfect. In terms of coliform bacteria, Capitol Lake compares favorably with Black Lake as a place to swim.

Water clarity measurements have been made in Capitol Lake since 1999. Figure 10 shows the results of monthly observations during spring and summer, 2013. The measurements are made by lowering a black and white plastic disk (“Secchi Disk”) to the deepest depth at which it can still be seen. The depth at which it disappears is recorded in meters.
In Figure 10, a change in shading has been added to show the four-foot depth. Any readings deeper than this indicate water that meets the swimming clarity standard. In 2013, all six measurements showed clear enough water for swimming; two of them barely so in May and June, four of them decisively so (July – October).

Figure 11 shows the average summer clarity of the North Basin water for the summers of years 1999-2013. During this 15-year time span, average clarity has been less than requireed for swimming only once, in 2009.
To summarize, Capitol Lake has met the water quality standards that apply to swimming for the last 15 years. A popular perception that the Lake is “unfit for swimming” is unfounded and inappropriate.
In addition to its healthy status with regard to coliform bacteria and water clarity, Capitol Lake has other attributes of a healthy body of water. These include its high dissolved oxygen levels and a relative absence of blooms of toxic blue-green algae. These attributes are described in the following.
III-2B. Dissolved Oxygen
One of the most critical features of lakes and rivers is the concentration of oxygen dissolved in those waters. Oxygen is required by all of the aquatic plants and animals that we notice in everyday life, and by legions of tiny bacteria that dwell in the water and on or in the bottom sediments. Without oxygen – particularly in the case of the large organisms – they die.
Water acquires dissolved oxygen in two ways; by absorbing it from the air and by photosynthesis of submerged plants. Processes that remove oxygen from the water are the respiration of animals, the respiration of bacteria, some chemical reactions in the bottom sediments, and (in some circumstances) the escape of oxygen to the atmosphere. Unseen by us but often astounding in its magnitude, oxygen consumption by bacteria is often as high as by the respiration of all of the animals that are large enough for us to see (Mann, 1982).
Dissolved oxygen (DO) is measured in milligrams of oxygen per liter of water (mg/L); its levels vary from zero (none) to about 15-20 mg/L at most. The salt content of salt water lowers its ability to hold dissolved oxygen; generally salt water has lower DO levels than comparable fresh water.
Oxygen is much, much scarcer in water than it is in air. Aquatic animals that use it there (especially those that live near or on the bottom) are often teetering on the brink of not having enough. Lakes in landscapes dominated by human activities are particularly vulnerable to degradation that can eliminate virtually all of the oxygen in their bottom waters, every summer. Figure 12 depicts a common way in which this can happen.

Briefly, nutrients that get into the water are used by algae at the surface for massive bursts of photosynthesis. Much of the oxygen they create escapes back into the air and is lost to the lake ecosystem. Algae sinking to the bottom are consumed by bacteria there, which with the larger animals there use up some, most, or even all of the oxygen in the bottom water. This zero-oxygen situation persists until fall and winter cooling of the lake causes cold, oxygen-laden water to sink to the bottom, eventually restoring normal oxygen levels there and “resetting” the system. Lakes that are vulnerable to this effect are deep ones that stratify thermally to inhibit mixing of the upper and bottom layers. Such deep lakes have insufficient light reaching the bottom for photosynthesis there.

Figure 13 shows an example of this effect for Hicks Lake in June, 2011. The graph is a type that is widely used by aquatic scientists, a “vertical pro-file”. The blue dots show the amounts of dissolved oxygen from the lake surface (0 meters deep, top of left vertical axis) to the bottom (11 meters deep, bottom of axis). The amount of oxygen at the surface is about 10 mg/L, the concentration decreases with depth to about 7 meters, and is near or at zero mg/L from 7 meters to the bottom.
The red squares (water temperature) show a pattern similar to the oxygen pattern. The warmer water on the surface floats on the colder water below and prevents the wind from stirring oxygen into the deep bottom layer. This is the reason why the vast amount of “new” oxygen added by phytoplankton at the lake surface can’t benefit the organisms on the bottom. During fall and winter, the surface cools, the cold oxygen-laden water sinks, and the lake returns to its starting condition of high dissolved oxygen at all depths by spring (as in upper left panel, Figure 12).
Figure 13 shows the bottom water situation for only one month (June) in Hicks Lake. The horizontal bar representing Hicks Lake in Figure 14 (below) is con-structed from similar vertical profiles for each month of the whole summer. As that bar shows, the bottom water in Hicks Lake ran out of oxygen in June 2011 and stayed that way throughout the entire summer.
All of the lakes monitored by Thurston County run out of oxygen in their deepest water as a result of this effect – except for Capitol Lake.
Figure 14 shows the months in which the TCPHSS dissolved oxygen data like those in Figure 13 show zero-oxygen water at the bottoms of the other monitored lakes. In Figure 14, each bar spans the season from May through October, 2011. Black segments of the bars show the months in which vertical profiles for those lakes in TCPHSS 2012 show zero oxygen in the bottom waters (as in Figure 13 for Hicks Lake). For aerobic organisms that require oxygen (fish, insect larvae, snails, clams, crustaceans), such water is uninhabitable. Those that can’t move to shallower depths die.
The bottom four bars in Figure 14 show the comparable situations for the North and Middle Basins of Capitol Lake. During the May-October season, both basins have abundant oxygen in the bottom waters. The lower bars (for 2005), filling data gaps for Capitol Lake for 2011, show the same story; that high-oxygen water is present at the bottom throughout the entire summer season.
Capitol Lake’s very favorable situation is caused by the flow-through of the Des-chutes River. The river receives a “super-charge” of dissolved oxygen when it roars over the Falls just above the Lake. This highly oxygenated water, usually colder than the lake, flows along the lake bottom and overpowers the forces that work to reduce DO’s. Additionally, because so much of Capitol Lake is shallow, sunlight reaches extensive areas of the bottom and drives plant photosynthesis (hence oxygen production) there.
Because of this unique deep-water oxygenating mechanism, Capitol Lake has the most favorable bottom habitat for freshwater organisms of any large lake in the county.
III-2C. Blue-Green Algae

Blue-Green algae (Cyanophyta) are single-celled or colonial photosynthesizing organisms. They are fundamentally different from all other photosynthetic algae in their cellular organization (see, for example, Brock and Madigan, 1988). When present in masses, the clumps can appear faintly bluish (the reason for their popular name) or greenish.
Some species have the very rare and remarkable ability to “fix” nitrogen gas from the atmosphere, namely to transform it from N2 into nitrogen nutrient molecules that they (and all other plants) can use. No other algae or plants have this ability. Three species are reported from Capitol Lake
The Thurston County Water Re-sources Reports name blue-green algae as the “dominant” algae in the County’s nutrient-rich lakes (TCPH-SS 2012). Capitol Lake is different for some reason that is not obvious, but which may be an effect of the non-stop flushing of that lake driven by the flow-through of the Deschutes River.

Most of the other lakes are threatened (or actually afflicted) by noxious “blooms” of blue-green algae that release unpleasant or even toxic chemicals into the water. An extreme instance occurred in Black Lake in 2000, when a huge growth of blue-green algae resembling a blue-paint spill piled up on parts of the western shore (TCPHSS p. 53, 2012). A brief summary of the blue-green algae status of the lakes shown in Figure 14 is displayed in Table 4. Hicks Lake, Summit Lake, and Capitol Lake are the only lakes mentioned in TCPHSS (2012) as having minor or insignificant blue-green algal growth. All of the others have experienced blue-green algae blooms or presences sufficient to warrant posting health advisories. The state standard for posting advisory notices is 6 mg/L of “microcystin,” a toxin of concern. Measured amounts in lakes that have exceeded this level are 13.9 mg/L (Black Lake), 166 mg/L (Long Lake), 55 mg/L (Pattison Lake), 50 mg/L (Lake St. Clair), and “more than 6 mg/L” (Lake Lawrence, also recently with 191 mg/L of “Anatoxin-a;” Figure 15, (Olympian May 29, 2015; TCPHSS 2012).
Capitol Lake’s special status with regard to blue-green algae is described by the Thurston County Health Department in these words: “In most nutrient rich Thurston County lakes, blue-green algae tend to be the dominant algae group and the ones associated with “algae blooms.” The algae composition of Capitol Lake is different, in that it tends to have more diatom species present than most other eutrophic lakes in this county. This is likely due to the lake’s location at the downstream end of the Deschutes River …” (TCPHSS 2012, p. 75).
In this regard, Capitol Lake is probably the healthiest Lake in Thurston County.
III-3. Water Quality: Best in Thurston County
Some features of the Thurston County lakes discussed above are summarized in Table 2. Despite its superiority to most other lakes in most ways, Capitol Lake is the only Thur¬ston County lake whose water quality has been designated “poor”. Yet it is one of the county’s healthiest lakes. As we have seen above, Capitol Lake could not be reasonably placed on the Category 5 303(d) list for “bacteria” if it were re-evaluated today. It is clear enough and clean enough for swimming and is among the healthiest of Thurston County lakes with regard to blue-green algae blooms and year-round dissolved oxygen levels. In its excess phosphorus levels, it is similar to other lakes that have been the recipients of runoff phosphorus.

IV. The Capitol Lake Ecosystem
The following sections discuss selected species from the biota of Capitol Lake. A full treatment of the Lake’s organisms is beyond the scope of this paper. The species mentioned are those that are relevant to the discussion of the Lake’s future.
IV-1. The New Zealand Mud Snail
Perhaps the only Lake species that most members of the public know about is the New Zealand Mud Snail (Potamopyrgus antipodarum, hereafter NZMS). These snails were first discovered in the Lake at Marathon Park in October, 2009 (Bartleson, 2010). Signs warning the public to stay away from the water were posted at that time (and afterwards) now serve as a constant daily reminder of the NZMS presence in the Lake (Figure 16).

The mud snails are tiny (usually less than 6 mm long; Figure 17). They are all females that repro-duce asexually (Bartleson, 2011). Their genetic diversity is limited and, as with all such organisms, they have little scope for adapting to changing environmental conditions. In waters that they invade, they multiply rapidly and become so numerous as to carpet parts of the bottom with millions of tiny snails. The main concerns expressed by wildlife managers are that these numerous snails might eat most or all of the algal resources needed by other, native herbivores, and that the NZMS’s themselves, if eaten by native predators, might malnourish those predators by passing through their digestive tracts undigested. (For example, see the Abstract and Introduction to Brenneis et al, 2011). They have been designated a “Prohibited Species” by the Washington Department of Fish and Wildlife, meaning their transport (even if inadvertent, on boots say) is illegal (King County, 2013).
Despite my reasonably diligent search for reports of ecological damage actually caused by these snails, none were found. One source frequently cited reports that rainbow trout lose weight when fed NZMS’s (Vinson & Baker, 2008). In this study, the fish had no other choice of food items and whether they would eat the snails in the wild is unknown. On the other hand, a study that presented three species of native Washington fishes and a native crayfish with a choice of foods (NZMS and two small native crustaceans, “G” and “A” ), suggests that the crayfish may actually benefit from the presence of NZMS’s (Brenneis et al, 2011). When given a choice in experiments, these big crustaceans actually preferred the NZMSs and ate lots of them. Thanks to their crushing, grinding mouthparts, all of the NZMS’s eaten by the crayfish were digested. The three fishes were relatively unaffected in their diet choices and amounts of native prey eaten in experiments with or without the presence of NZMS’s. The Brenneis study also examined wild populations of these fish species and showed that these fishes don’t eat the mud snails

Our big, aggressive native crayfish may find NZMS’s a preferred new food resource. The crayfish and two of the three fishes examined in the Brenneis study (Flounder and Stickleback) are found in Capitol Lake, along with four other fishes that are reported as including snails in their diets (Wydoski and Whitney 1979; Entranco 1997).
A statement that the snails may not really pose a threat to aquatic ecosystems is provided by Wiltshire (2014). In his words:
Are the snails really detrimental to aquatic ecosystems? If that is the claim, then the agencies making it are obliged to prove it. They have not done so. Thus far, no compelling evidence of damage to any aquatic ecosystems by New Zealand Mud Snails has been presented by any agency to justify closing Capitol Lake to boating and other recreation.
IV-2. Aquatic Insects and Bats
Fresh water is home to myriads of insects that play significant roles in aquatic ecosystems and in nearby upland environments. The insects that live in water pursue different life-styles – herbivore, detritivore, predator – and include species that take oxygen from the air and those with gills that extract oxygen from the water.

Capitol Lake’s aquatic insects support a huge population of Yuma Myotis bats (Myotis yumanensis; Figure 18) that fly from “maternity colonies” at Woodard Bay and The Evergreen State College all the way to Olympia and back on summer nights. The Woodard Bay population forms one of the largest known colonies of this bat species in all of Washington State (Hayes et al, 2008 citing Olmstead pers comm.; Falxa pers. comm. 2015). Three other bat species – Little Brown Bats, Big Brown Bats, and Silver-haired bats (respectively Myotis lucifugus, Eptesicus fuscus, and Lasionycteris noctivagans) – also forage regularly over Capitol Lake and an additional three species are occasionally present (Hayes et al, 2008).
The aquatic insects that support these bats are mayflies, midges, and others that spend their early lives (immature stages) in water, then emerge from the Lake surface and fly away (Figure 19). Many of them – mayflies, for example – live on the lake bottom for a year or two or three before emerging for a brief life as a flying adult. As year-round denizens of the Lake bottom, these immature insects are critically dependent upon high oxygen levels in the deep water for every month of the year. As we have seen (Figure 14), Capitol Lake is one of the few large lakes (perhaps the only one) that meets this criterion at all depths.

Numbering more than 3000 individuals, each of which can eat approximately its own weight (4-6 gm) in insects every night, the Lake’s bat patrol is capable of consuming some 15 kg of the flying adult stages of mosquitoes, midges, mayflies, caddis flies and other insects every night (Harvey, Altenbach and Best, 1999).
The Yuma myotis bats’ preferred habitat is anywhere – be it forested, open, suburban, or even desert land – that is near open fresh water (Harvey et al, 1999). Were Capitol Lake to be destroyed, it would be difficult or perhaps impossible for the Woodard Bay colony’s bats to find a comparable food resource elsewhere. Capitol Lake is the closest large fresh water body to their colony. The seasonally anoxic deep waters of the other large lakes may well support diminished populations of the aquatic insects whose immature stages live on the bottom for a year or more. In any case the insects now emerging from those other lakes are almost certainly being fully utilized by other bats already in residence there (Falxa, pers. comm. 2015).
In addition to feeding bats, the insects of Capitol Lake appear to constitute an important food source for fishes. For example, Engstrom-Heg (p. 38, 1955) reports that 85% of the wet weight of stomach contents taken from juvenile Chinook Salmon in the Lake in 1955 consisted of immature (pupal Chironomid) midge insects. Hayes et al (2008) mention that 42-70% of the diets of juvenile fall-run Chinook Salmon and 49-96% of the diets of juvenile Chum Salmon consisted of Chironomid larvae in the “freshwater portion of the restored Puyallup estuary” in 1987-88.
IV-3. The Olympic Mudminnow
Only one species of native fish occurs entirely within the boundaries of the State of Washington (that is, is “endemic” to Washington). That is the Olympic mudminnow (Novumbra hubbsi; Figure 20), a small colorful fish whose range consists mainly of streams and ponds on the west side of the Olympic peninsula, a few streams and ponds in the southern Puget lowlands, and Capitol Lake (Mongillo & Hallock, 1999).
Mudminnows are carnivores that eat small crustaceans, worms and insects. Their preferred habitat is “… quiet waters with a mud substrate and dense aquatic vegetation (Wydoski and Whitney 1979; see also Page and Burr 2011 for a near-identical description of preferred habitat). Their populations appear to be stable, however they are dependent upon “healthy wetland habitat” for their continued survival.

Olympic mudminnows were found during stranding surveys made during drawdowns of Capitol Lake. Those surveys were not very explicit about the species observed, but mudminnows were among the few species named and discussed (Entranco 1997) or listed as “present” (Herrera Environmental Consultants 2004).
Biologists with the Washington Department of Fish and Wildlife listed the mudminnow as a “sensitive species” on account of its very restricted range and vulnerability to wetland loss (Mongillo and Hallock, 1999; WDFW 2008).
Capitol Lake, 270 acres in extent, may constitute more prime habitat for this species than all of its other Puget Lowland locales combined, and in that regard may be of key importance as a refuge for this species.
IV-4. Freshwater Mussels in the Lake
A native freshwater mussel (Anodonta sp) is the largest and most conspicuous mollusk in the North Basin of Capitol Lake today (Figure 21). One can hardly help noticing their large shells on the bottom in the shallow water along the east shore. These bivalves were almost certainly absent from the Lake before 2009.
Anodonta species have experienced localized extermination throughout their range to the south of Washington State, but appear to be stable in Washington and to the north (Hovingh, 2004; Nedeau et al, 2009). At present, Capitol Lake appears to be important habitat for native Anodonta mussels, whose populations would be destroyed if the Lake were changed to an estuary. Its conservation should be considered in any discussion of the future fate of the Lake.

IV-5. Introduced Species in the Lake & Budd Inlet

Recitations of the alleged problems of Capitol Lake often include mention of introduced (non-native) species (see for example Rosenberg, 2014). Foremost among these species is the New Zealand Mud Snail. That one and others less frequently named are shown in Table 3. Usually not mentioned is the fact that Budd Inlet itself, as are estuaries in general (see for example Cox Chapter 5 1999, also Carlton 1979), is rife with introduced species that would simply move in to replace the freshwater organisms now in the Lake basin, were the Lake to be replaced by an estuary. A list of introduced species reported to occur in Budd Inlet is shown in Table 4.
Nearby lakes also have introduced species, some not known to occur in Capitol Lake. An example is the “Chinese mystery snail,” Cipango-paludina chinensis, occurring in Ken, Long, Hicks, Chambers, St. Clair and Pattison Lakes (Johannes, 2010b). Likewise, there are many introduced species in nearby South Sound estuaries that almost certainly occur in Budd Inlet but have not been formally “reported” there to my knowledge. These include a seaweed (Sargassum muticum) and at least 10 species of small invertebrates (Cohen et al, 2001).

A discussion of the impacts of introduced species is beyond the scope of this paper. As is well known, some are considered “useful” (for example, bass, perch, water lilies, oysters, clams, mussels), others can wreak havoc in native ecosystems (by, say, becoming dominant and even driving native species to extinction). Most simply settle in harmlessly or even eventually disappear after their initial introduction (see Williamson 1996; Cox 1999; Carlton 1979).
If the presence of introduced species is of overriding concern, the Capitol Lake basin would be occupied by just as many of these, and probably more, if an estuary were to replace the Lake. The species of greatest concern – the New Zealand Mud Snail – would probably thrive there, given its ability to live in salinities typical of brackish water (LeClaire and Cheng, undated).
IV-6. Lake Drawdowns: Controlling or Helping New Zealand Mud Snails?
Ecologists have recognized for many decades that undisturbed native (“climax”) communities resist invasive species, whereas disturbed habitats are fertile ground for invasion by non-native species (Elton, 1958). A somewhat detailed description of our present understanding of this property of ecosystems is presented in this note.

Capitol Lake has been subjected to severe, frequent disturbances almost every year since the Lake was formed. Most recently, for the sake of killing a few per cent of the pop-ulation of New Zealand Mud Snails, the Lake has been drawn down during freezing weather and left with its bottom exposed for days and nights on end (Figure 22; Figure 21b). In addition to killing the snails, such treatment must inevitably also kill native animals that, if given a chance to establish their own dense populations, might control the snails by themselves. In addition to dying of exposure, some species (such as pea-mouth minnows and crayfish) are undoubtedly eaten by foraging raccoons, gulls, otters, and other animals, as are other native species (mussels and Olympic mud¬minnows).
As noted, NZMS are all females. They have a rapid life cycle and every individual, reproducing asexually, can produce offspring that can themselves start producing young within a few weeks.
By contrast, potential predators such as those killed by the draw-downs (fish, crayfish) are sexual animals with lifespans measured in years. Only half of the individuals (the females) can produce young, and weeks or months must pass before those juveniles reach maturity, full size, and their full function as effective predators. Lake drawdown assaults on the benthic community can only benefit the short-lived, fast-reproducing types – not their big, long-lived, slow-reproducing predators and competitors.
The drawdowns disrupt the whole freshwater community, not just the population of New Zealand Mud Snails. There are several reasons why they should be stopped. Ramping up native predator pressure on the NZMS’s may be one of them.
IV-7. Species Diversity in Lakes & Estuaries; An Overview

The heads of estuaries are among the most species-poor habitats of all familiar ecosystem types. The reasons are that intertidal organisms are stressed by being exposed to air, then covered by water, then exposed to air, day after day after day. This exposure can subject them to freezing temperatures in winter, broiling heat in summer, rain some times and severe drying at others.
Intertidal and subtidal estuarine organisms are also severely stressed by the drastically opposite osmotic demands made on them by salt water and fresh water. Few species can live in this alternating regime of wet/dry/ wet/dry hot/cold hot/cold coupled with salt/fresh salt/fresh challenges.
Figure 23 illustrates a common pattern in change in species diversity that occurs as one proceeds down a river, seaward down its estuary, and out to the ocean (left to right on the graph). The total number of species (uppermost line) drops drastically as one reaches the estuary, then starts to increase and returns to a high level at the ocean (right of Figure, salinity about 35 parts per thousand [“o/oo” in the Figure]).
At the point where the species diversity is smallest (at the place where the average salinity is about 4 ppt in this Figure), the species actually living there are a mix of salinity-resistant freshwater species, other species that are adapted to brackish water and thrive in it, and a few truly marine species that manage to penetrate landward all the way from the ocean coast to the head of the estuary. Local examples of these three types are the New Zealand Mud Snail, the Softshell Clam, and a barnacle (respectively Potamopyrgus antipodarum, Mya arenaria, and Balanus glandula. See Kozloff, 1996, for descriptions of estuarine and fully marine species).
In terms of species diversity, removing Capitol Lake and replacing it with an estuary would destroy a species-rich ecological community and replace it with a species-impoverished community. Given that “… the vast majority of habitat in the estuarine option is mudflats…” (Hayes et al, 2008), mostly populated by burrowing organisms – clams, worms, perhaps tunneling shrimps – the lush appearance of the Capitol Lake community would be replaced by a visually barren landscape of tan-colored mud during the mid-day low tides.
V. Why Does Such a Healthy Lake have a Negative Image?
Given the many positive attributes of Capitol Lake and the fact that its negative features (high phosphorus levels, for example) are not much different from those of other lakes, it is clear that the Lake is one of our area’s most valuable assets. Yet, somehow, perhaps inadvertently perhaps not, its reputation has been smeared. There are at least seven reasons for its negative image in the public eye. These are briefly addressed in the following.
V-1. Misleading Information on Signs Posted Around the Lake

The photograph in Figure 9 above (swimmers at the Lake in 1964) is replicated on a misleading interpretive sign on the west side of the Lake (Figure 24), which informs passers-by that the swimming area can never again have high water quality. On the sign, the caption says:
“No more. Area residents enjoying the public swimming area of Capitol Lake in 1964. Water quality would not increase sufficiently for residents to safely swim under any of the alternative futures for Capitol Lake.”
In fact, the sign is wrong. The area shown has had high water quality since at least year 2000 (see above discussion in “Swimming” section).
V-2. Alarmist Emphasis on the New Zealand Mud Snail

Of some 32 sites in Washington State where the NZMS is now found, Capitol Lake is the only body of water closed to public use on account of the snail (Holman, 2015. See USGS 2015 for list of NZMS sites). The claim is that the closure helps prevent the spread of the snails.
An example of a snail site that is not closed is the boat launch at Blue Slough of the Chehalis River (Figure 25). At this much-used recreational location, the WDFW sign cautions against letting dogs enter the water and urges users to take other (seemingly unrealistic) precautions. Lake Washington is also home to NZMS’s; no closures or quarantines of waters have occurred there.
Visitors to Capitol Lake finds signs everywhere warning them to avoid contact with the water. Their effect is to constantly remind area residents of some “threat” posed by the dreaded NZMS and, by association, by Capitol Lake itself
There are now hundreds of sites inhabited by the NZMS in the US. Capitol Lake is the only one that is closed to public use (Holman, 2015).
V-3. Negative Bias Against the Lake in Newspaper Reporting

Capitol Lake’s water level was lowered during freezing weather on several occasions during winter 2014 - 2015 (Martin, 2015a; Figure 26). Each drawdown was accompanied by an article in the Olympian newspaper. The front or second page articles and captions explained that the drawdowns were to “help control New Zealand Mud Snails”.
These news items had the incidental effect of reminding the public of this supposedly negative aspect of the Lake.
News of several other important drawdowns has always been conspicuously absent from the newspaper. The lake was drawn down at least four times during periods of high tides and torrential rains during the same 2014-15 interval (Martin, 2015b) in a successful effort to prevent downtown flooding.
Not once was that positive aspect of Capitol Lake mentioned in the Olympian.
V-4. Trash Strewn Shores

Persons walking around Capitol Lake can hardly fail to notice the trash strewn everywhere in the waters and along the shores. The author has noticed that some of it lies or floats there for months (Figure 27).
The reaction of people visiting the lake and noticing this neglect is one of disgust.
Unfortunately, instead of directing their anger toward the agency responsible for decades of custodial neglect, their anger translates into negative feelings about the Lake itself.
V-5. The Weedy Appearance of the Lake - The Most Misleading Negative Symptom
During the summer, mats of floating algae and widespread clumps of rooted plants spreading over the surface give the Lake an obvious unkempt appearance. (Some observers report an unpleasant odor from the plants, as well.)
This painfully obvious symptom that all is not well is noticed by virtually everyone and is the main reason for the widespread view that “the Lake is sick.”
This symptom is easily fixable and indeed is actually a sign that the Lake is performing a tremendous “ecosystem service” (behind the scenes) for our community.
The Lake’s plants and algae owe their exuberant growth to the fact that the Deschutes River carries the next-highest load of nitrogen nutrients toward South Puget Sound of any river, stream, creek or seep, second only to the Nisqually River. Capitol Lake intercepts most of that nutrient load during the summers and prevents it from entering Puget Sound. The amount captured by Capitol Lake in September, 2007 was about the equivalent of 87 fifty-pound bags of fertilizer (@ 10% nitrogen) every day.

Figure 28 shows what happens to nutrient nitrogen when it enters the Lake. Blue bars show the concentration of nitrogen in the water entering the Lake and red bars show its concentration in water exiting the Lake at the dam, all arranged along an axis that starts in January and goes to December (1977). During the growing season, the Lake’s plants extracted almost all of the River’s nutrient nitrogen during that summer.
By this measure, the Lake’s plants are a cause for celebration, not censure. The plants we see in the Lake every summer are biomass prevented from growing in Puget Sound. The marine biomass that that growth would create in the form of algae and phytoplankton would by its decay consume oxygen in the bottom water (by the mechanism shown in Figure 12 above), were it not for this interception by the Lake’s plants.
The appearance of the plants is a cosmetic problem that could be easily solved by well-known techniques of periodic plant harvesting.
If properly conducted, plant harvesting would also permanently remove from the waters the nitrogen embodied in the plant biomass taken from the Lake.
V-6. Inadequate CLAMP Attention to Species that that would be affected by Lake Removal
A report to the CLAMP Steering Committee by Hayes, Quinn and Hicks (2008) assesses possible effects on various marine, lake-dwelling, and terrestrial species of replacement of the Lake by an estuary. A puzzling feature of this report is its consistent omission of certain species that, if analyzed, would strengthen the argument for preserving the Lake.
For example, the authors consider 16 species of fish (ten of them native Washington species) that have a “significant presence” in the Lake. Not surprisingly, the authors envision that destroying the Lake would “substantially reduce, or perhaps in some cases eliminate populations” of these species. All 16 of them would experience “negative consequences” if the Lake were replaced by an estuary (their Table 10).
The Olympic Mudminnow, mentioned earlier in this paper as a “State Sensitive Species, is not one of those 16 species. Indeed, it is conspicuous in the Hayes Report’s analysis by its absence. The Mudminnow is named and mentioned just once, in their Appendix I: “Excluded Species” (p. 91). The reason for omitting it is given as “Capitol Lake not preferred habitat”. Yet this small fish was encountered and discussed in the fish stranding survey by Entranco (1997; Table 2 Appendix B) and mentioned in a review of literature by Herrera (2004). The description of the mudminnow’s “preferred habitat” by Wydoski and Whitney (1979), quoted verbatim earlier in this paper to show its close similarity to Capitol Lake, is in striking contrast with its reason for dismissal given in the Hayes Report. All three of these references were known to Hayes et al (2008) and were cited by them.
It is likely that the Mudminnow would be locally exterminated along with the other 16 freshwater fish species in that basin, were Capitol Lake to be replaced by an estuary. Yet Hayes et al (2008) somehow overlooked it.
An analysis of the bats that depend upon insects emerging from Capitol Lake is presented on one page by Hayes et al (2008). Their accompanying Table 13 indicates that the effects of destruction of the Lake would be “no change in status quo” for two of the scarcer bat species (Big Brown Bat and Silver-Haired Bat) and “negative” for the two very common species. In words, the authors limit themselves to this phrase; “… a decline in bat breeding colony numbers may occur if the existing lake is converted to an estuary”. Their assessment of the effects on the aquatic insects that feed the bats is presented later in the report in three paragraphs accompanied by their Table 16. The Table indicates that the effects of destruction of the Lake on Caddis flies, Mayflies, and Crane flies would be “negative”.
The authors’ weak conclusions seem optimistic to a local bat researcher (Falxa, pers comm. 2015). Specifically, destroying the lake would decimate the local Yuma myotis bat population and perhaps result in the relocation or abandonment of the important breeding colony sites at Woodard Bay and The Evergreen State College.
Anodonta mussels were not present in Capitol Lake when Hayes et al conducted their review. The modern-day presence of these mussels requires a serious look at likely consequences for the species’ regional success if their Lake habitat is destroyed.
V-7. Mistaken Interpretations of Outputs of a Department of Ecology Computer Model
Figure 29 shows an outline of Capitol Lake produced by a computer model currently in use at Ecology. The model divides the Lake into 280 squares. While simulating the seasonal changes in Lake oxygen, phytoplankton, plants, and other features, the computer “flags” (colors) a square whenever it calculates that the dissolved oxygen level in that square has fallen below some water quality standard. The end result is this map. Each colored square shows the worst DO violation that occurred in that square all “year”. As shown by the key at the right, the worst of these “violations” (red colors) are on the order of 4 mg/L – a huge drop in dissolved oxygen below the “standard”.
This Figure has supported the belief by almost everyone who has seen it that Capitol Lake is a severely impaired body of water. The most important thing to know about it is that, although it does technically display a measure of DO water quality standard violations, the violations have no significant relationship to real-world water quality issues in Capitol Lake.

Essentially, the modelers found that Capitol Lake violates a standard by comparing the Lake in its present condition with the Lake as it is supposed to have existed in some natural condition at some time in the past. Their explanation hinges upon properties of the Deschutes River. In its “natural” (pre-modern) condition, the River is said by Ecology to have been three degrees Centigrade colder than it is today (Ahmed et al, 2014). Since cold water holds more dissolved oxygen than does warmer water, and since the colder river fed the Lake in the past, by comparison with that hypothetical situation modern Capitol Lake is indeed in “violation” of a modern water quality standard. Essentially, the modelers claim that the Lake holds 2-4 mg/L less dissolved oxygen today than it could if the River were colder; that is the “violation” shown in Figure 29.
A glance at the present-day (2014) condition of the Lake shows that ECOLOGY’s technical “violations” are not useful information. Nor do they show any real-world impairment of the Lake environment for any animal species. Figure 30 compares a few real-world benchmarks with the present-day dissolved oxygen levels in Capitol Lake in 2014. Dissolved oxygen levels in the Lake are higher than the “extraordinary” standard level (7.0 mg/L) all summer long, higher than the standard for the lower reach of the Deschutes River (8.0 mg/L), and much higher than any low DO levels that would be cause for concern.
Suffice it to say that the ECOLOGY’s “violations” portrayal (Figure 29) bears no relation to any ecological reality of real-world concern. Unfortunately it has misled many readers to think that it does, and has contributed substantially to views that Capitol Lake is an impaired body of water.

VI. Conclusions and Suggestions
Capitol Lake’s present-day negative reputation is unwarranted. The Lake is probably the healthiest, most robust body of fresh water in our county.
Thanks to sustained community actions and commitment, the water quality problems that plagued Capitol Lake during the 1980’s have been eliminated to a point at which the Lake is now suitable for swimming. As a related result, the Lake now serves as prime habitat for a rich assemblage of species that find high-oxygen conditions there superior to those of all other lakes. This is a success story for which many agencies, communities, and dedicated individuals can take credit.
From an environmental standpoint, there is room for further improvement. One suggested action would be cessation of the disruptive lake drawdowns. These draw-downs prevent the development of a stable “climax” aquatic community. Such a community would almost certainly include effective potential predators of the New Zealand Mud Snails (several fishes and the native crayfish) and perhaps potential competitors. Another would be a policy of routine harvests and removals of mats of floating and some rooted plants. This would physically remove the nutrients that the Lake plants capture from all waters, and would improve the appearance of the Lake. The dredging and removal of accumulated sediment (not considered in this paper) might be another positive action for the future.
As a final personal observation, a colleague and I had an opportunity to row out to the center of the North Basin in September 2013 for the purpose of taking water quality measurements. On that sunny day, ours was the only boat on the entire abandoned Lake. We had a chance to see Olympia, our Capitol, the shores of the Lake, the Deschutes Parkway, and Marathon and Heritage Parks from the center of our Thurston County universe and to realize that all of it was beautiful. Sadly, we also realized that this grand view of the place where we live had been forbidden to all other residents and visitors for four years by then, by closure of the Lake.
It’s time to move forward and reclaim one of our community’s biggest natural assets – Capitol Lake.
Additional Information & PDF Supporting Documents
Acknowledgements
This Report could not have been written without the extensive help and encouragement of many people. THANKS to all of you for your support and insights during this long research and writing process!
Foremost among the leaders is John DeMeyer, a colleague who single-handedly researched a vast number of issues - sedimentation, nutrient budgets, river flow data, coliform levels and the like – for at least 8 years, and who graciously shared all of his findings with me. Whenever I was stumped – John knew how to find the answer. Others who provided information and feedback are Jack Havens, Bob Holman, Jewel Goddard, Ginny Stern, Oscar Soule, Bob Wubbena, Allen Mills, Denis Curry, Gerardo Chin-Leo, Erik Thuesen, and Dan Cheney. I am particularly indebted to four scientific reviewers; my colleague Dr. Kaye V. Ladd (chemist) and three unnamed others with expertise in water pollution issues, limnology, and botany.
Most of all, my thanks and gratitude go to my wife Dee for her long, enduring patience and support while I was engaged with this project. THANKS, Dee!
Copyright Information
PDF Download & Print versions
Executive Summary (1 page PDF)
Document with References & Notes (50 page PDF)
List of Figures, Tables & Acknowledgments (6 page PDF)
Dr. David Milne's professional background, July 2014 (1 page PDF)
Capitol Lake - The Healthiest Lake in Thurston County
by: Dr. David H Milne © June 15, 2015Capitol Lake is an environmental treasure that is worthy of preservation for many reasons, and sustainable by well known routine management procedures, notably dredging and plant harvest, for all of the foreseeable future.